Alte­ryx Desi­gner
The lea­ding solu­ti­on for data pre­pa­ra­ti­on, data mer­ging and data ana­ly­sis
// Alte­ryx Desi­gner in detail

Prepare. Merge. Repeat.

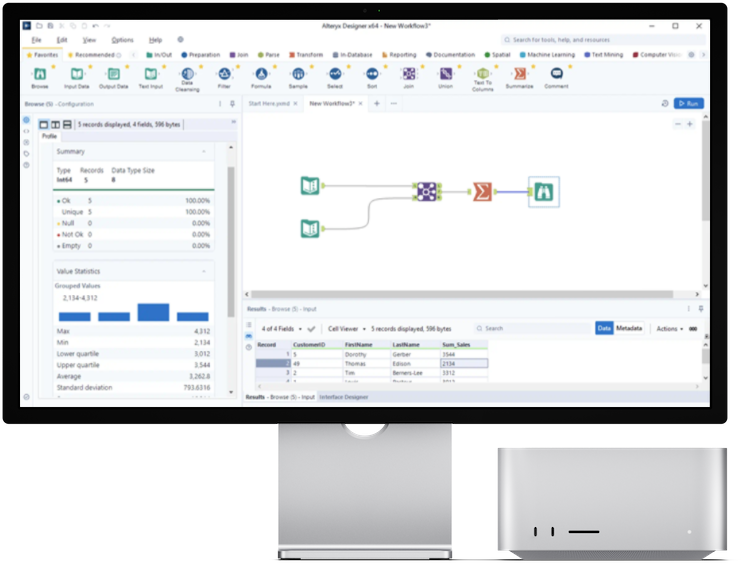
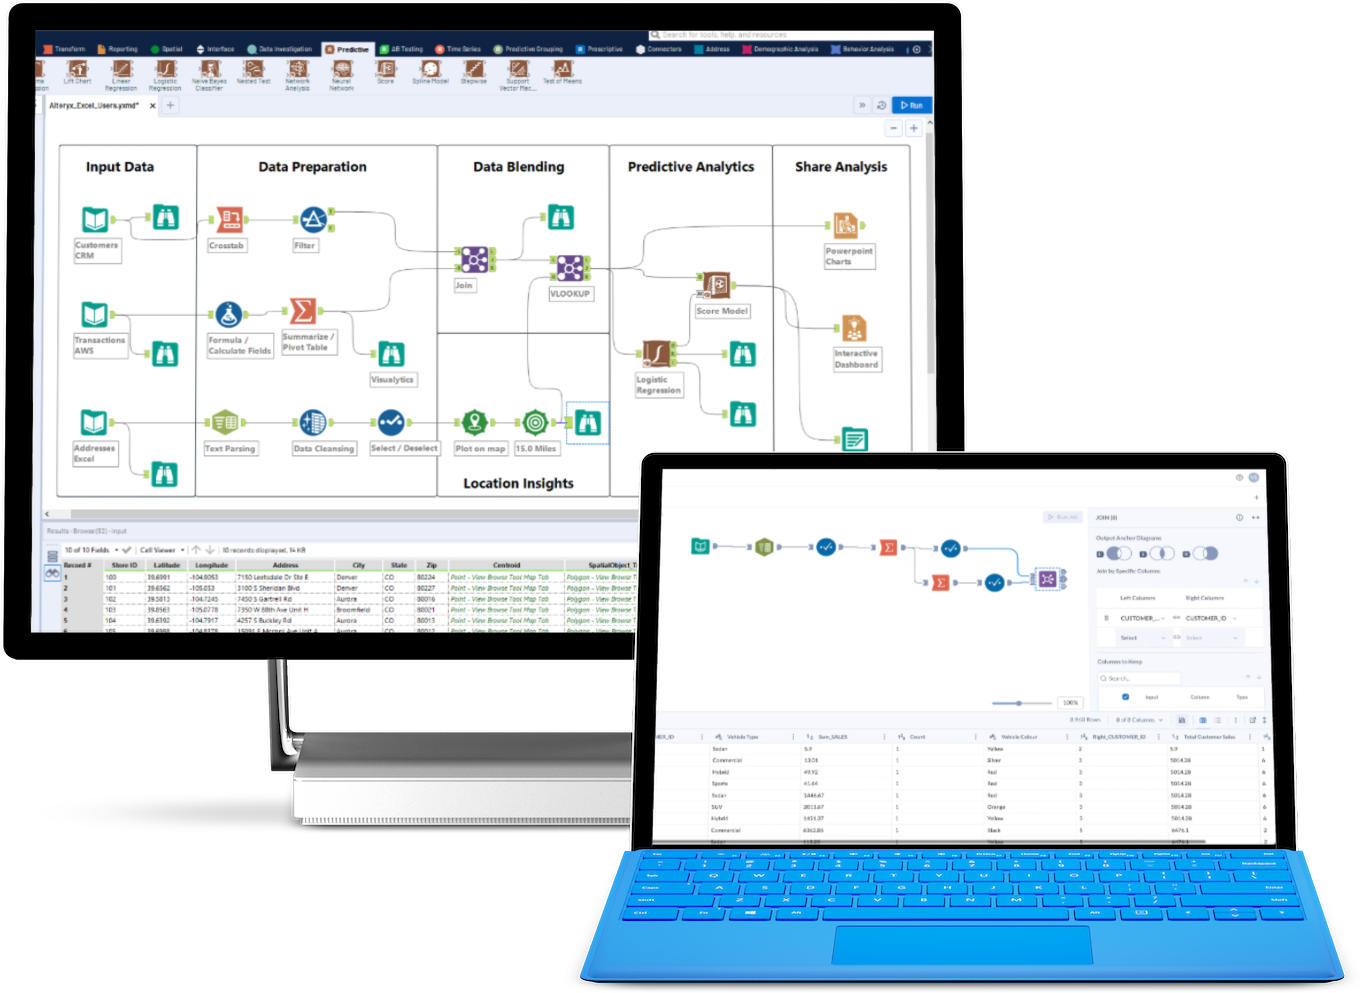
Alte­ryx Desi­gner enables ana­lysts and data sci­en­tists to crea­te a self-ser­vice data ana­ly­sis expe­ri­ence to extra­ct ans­wers from vir­tual­ly any data source.

Auto­ma­te every step of ana­ly­sis, inclu­ding data pre­pa­ra­ti­on, data mer­ging, report­ing, pre­dic­ti­ve analytics and data science. Access any data source - lar­ge or small, in the cloud or on-pre­mi­ses - and expe­ri­ence the sim­pli­ci­ty and power of a self-ser­vice plat­form.

// Data science made easy

Scalable analyses for the company

01

From the cloud, local­ly, from Excel, whe­re­ver - even wit­hout uni­que iden­ti­fy­ing fac­tors

01

Combine data records

Combine data records
02

Pre­dic­ti­ve, sta­tis­ti­cal and spa­ti­al - code-free for ana­lysts or code-fri­end­ly for data sci­en­tists

02

Analyses for all

Analyses for all
03

When buil­ding your work­flow and sha­ring your analytics with Visua­ly­tics

03

Visual insights

Visual insights
// Fle­xi­ble inte­gra­ti­on and exten­si­on

Faster insights, smarter decisions

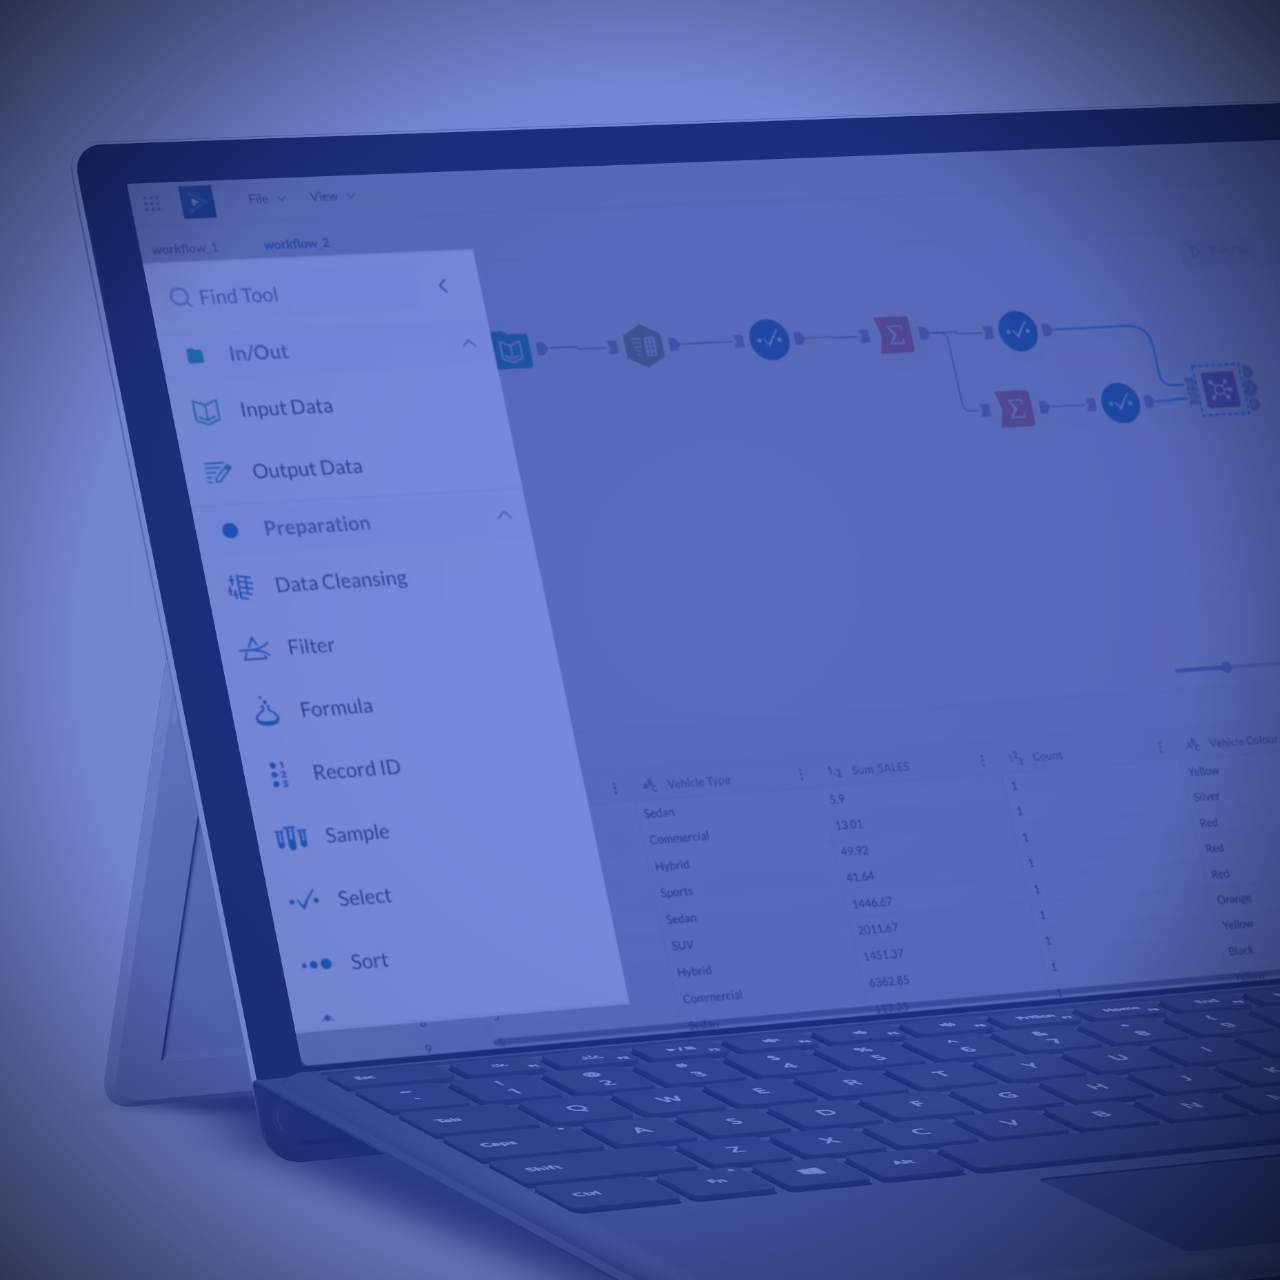
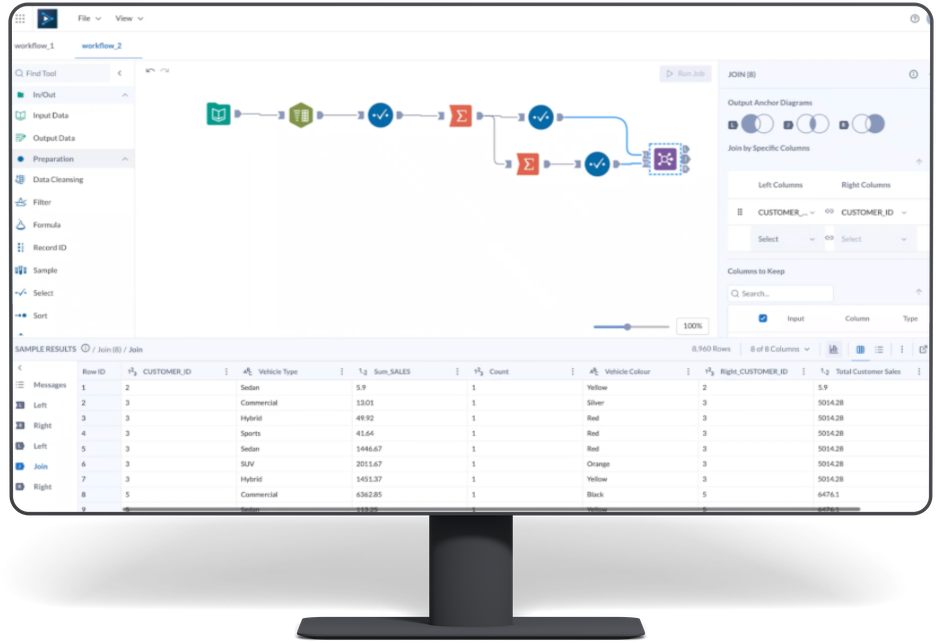
With over 300 no-code/­low-code auto­ma­ti­on modu­les, you can effort­less­ly crea­te ana­ly­ti­cal work­flows for all your busi­ness pro­ces­ses. Easi­ly inte­gra­te your solu­ti­on with over 80 data sources, inclu­ding spreadsheets, docu­ments, cloud sources, Snow­fla­ke and RPA bots. Refi­ne your data by adding demo­gra­phic, firm­o­gra­phic and geos­pa­ti­al data.

// The most important at a glan­ce

Connect to data wherever they are

The tool offers over 70 nati­ve data con­nec­tions and the abili­ty to scra­pe web data to use almost any available data source, whe­ther it’s data warehou­ses, ERP or cloud-based appli­ca­ti­ons, flat files, office appli­ca­ti­ons, social media data or lega­cy analytics plat­forms - whe­ther the data is in the cloud, on your desk­top, in tra­di­tio­nal sto­rage or on the web.

Automate the essential parts of the analytical process

You can pro­cess your data up to 100 times fas­ter and mer­ge mul­ti­ple sources, whe­ther it’s big, small, dir­ty, raw, or data from dis­pa­ra­te sys­tems. You can cle­an­se your data and levera­ge the fle­xi­bi­li­ty and power of the cloud for your Big Data analytics. Alte­ryx Desi­gner allows you to eli­mi­na­te manu­al data pre­pa­ra­ti­on tasks such as remo­ving zeros and dupli­ca­te ent­ries, grou­ping or mer­ging data, fin­ding uni­que values, and more.

Visual analysis of data at any stage

Inline Visua­ly­tics instant­ly vali­da­tes the health, qua­li­ty, and sta­tis­ti­cal dis­tri­bu­ti­on of your data in your work­flows to opti­mi­ze your analytics pro­cess. You can share Visua­ly­tics insights with your stake­hol­ders for fur­ther inves­ti­ga­ti­on and deeper under­stan­ding of your ana­ly­sis through mul­ti­ple inter­ac­ti­ve charts.
Sca­lable analytics for the enter­pri­se
Sca­le data pre­pa­ra­ti­on and ana­ly­sis pro­ces­ses across cloud, on-pre­mi­ses, and hybrid sources.

Predictive, prescriptive and statistical modeling

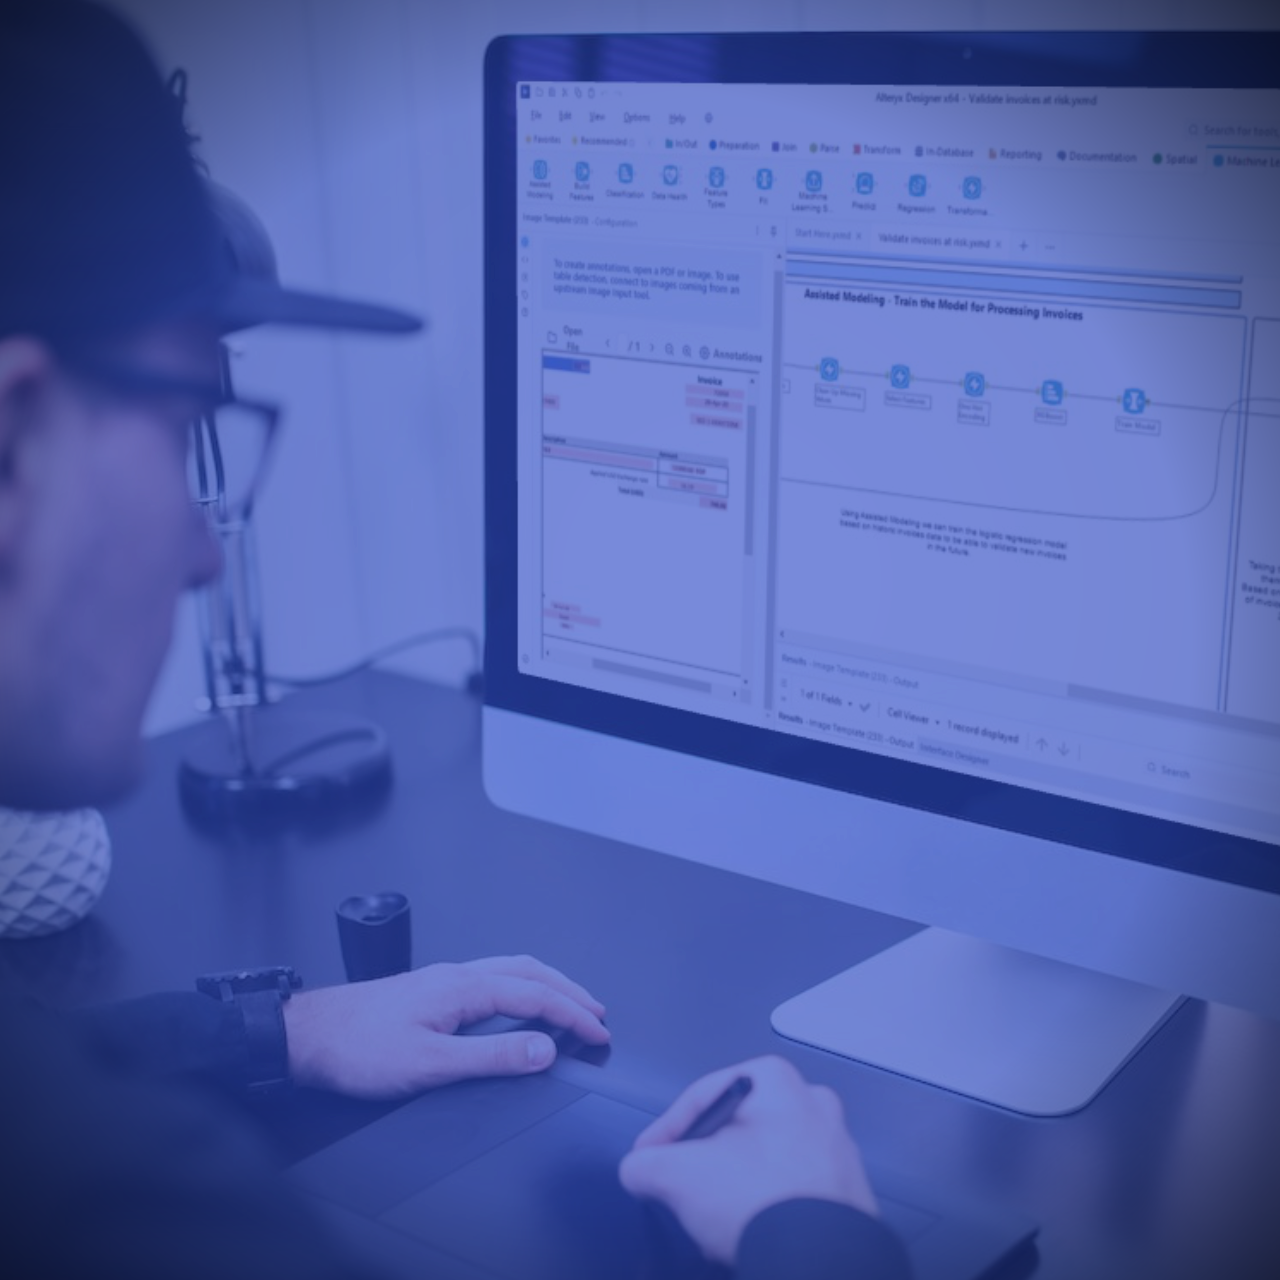
You have visu­al access to all data and can per­form various types of regres­si­on ana­ly­sis, neu­ral net­works, decis­i­on trees, time series mode­ling, and more. In the pro­cess, data sci­en­tists and home users can work with the help of more than 50 pre-built, code-free tools or real­ly get down to the busi­ness of wri­ting R and Python scripts.

Enriched Insights with Spatial Analytics

Alte­ryx Desi­gner also pro­vi­des Spa­ti­al Analytics to opti­mi­ze your busi­ness decis­i­ons with spa­ti­al data and analytics. You can opti­mi­ze mar­ke­ting cam­paigns, sales ter­ri­to­ries, trans­por­ta­ti­on and logi­stics, or ser­vice covera­ge by per­forming and visua­li­zing advan­ced loca­ti­on-based cal­cu­la­ti­ons, such as dri­ve-time, trade area, spa­ti­al matching, and crea­ting analytics - all in the same ana­ly­tic work­flow.

Output and share results for faster business results

Bring your insights to life in the for­mat that works best for you. Crea­te cus­tom reports with maps, data tables, text, images, and charts - in a varie­ty of for­mats inclu­ding PDF, HTML, DOCX, XLSX, and more. Crea­te, share, and publish cus­tom ana­ly­tic appli­ca­ti­ons wit­hout pro­gramming. Final­ly, share the right data, in the right struc­tu­re, direct­ly to powerful visua­liza­ti­on for­mats like Micro­soft Power BI, Tableau, or Qlik.
// Inte­res­ted?

Contact us!

Do you have ques­ti­ons about Alte­ryx Desi­gner and StatSoft’s ser­vices, would you like to purcha­se a licen­se or request a pro­ject? Our pro­ject mana­gers and Alte­ryx experts are rea­dy to help you. Plea­se cont­act us.