An AI-powered user experience
with integrated data wrangling and advanced analytics
// Spotfire™ Features
Intelligent, visual analyses
Spotfire™ is the most comprehensive analytics solution on the market, enabling users to visualise data quickly and easily.
Using search queries and recommendations provided by an integrated artificial intelligence engine, users can analyse data to gain insights. Whether you want to create simple dashboards, forecast applications or dynamic real-time analytics applications.
// Real-time analysis applications
Spotfire™ offers numerous scalable functions
01
With automated inline data processing in Spotfire™, you can connect, merge, cleanse and process data from any source, including Big Data stores.
01
Data Wrangling
02
With out-of-the-box predictive methods for classification, clustering and forecasting, anyone can get started with predictive analytics with just one click.
02
Forecast Analyses
03
Spotfire Data Streams continuously provides new data for real-time analysis. You can create interactive dashboards with real-time IoT, social media and messaging sources as easily as with static data.
03
Streaming Analyses
// Visual analytics with Spotfire
Data visualisation with a redesigned, multimodal UX
The deep data visualisation and exploration that Spotfire is known for is now even more agile, AI-driven and wrapped in a beautiful new user interface that makes interacting with and visualising your data a breeze. Whether you’re a business user or an analytics professional, you can now analyse and explore your data the way you want - through AI-powered recommendations, NLQ-driven search or traditional direct manipulation. With Spotfire, you choose the interaction that suits you.
// TAKE YOUR ANALYTICS TO A NEW LEVEL
Your advantages with Spotfire™
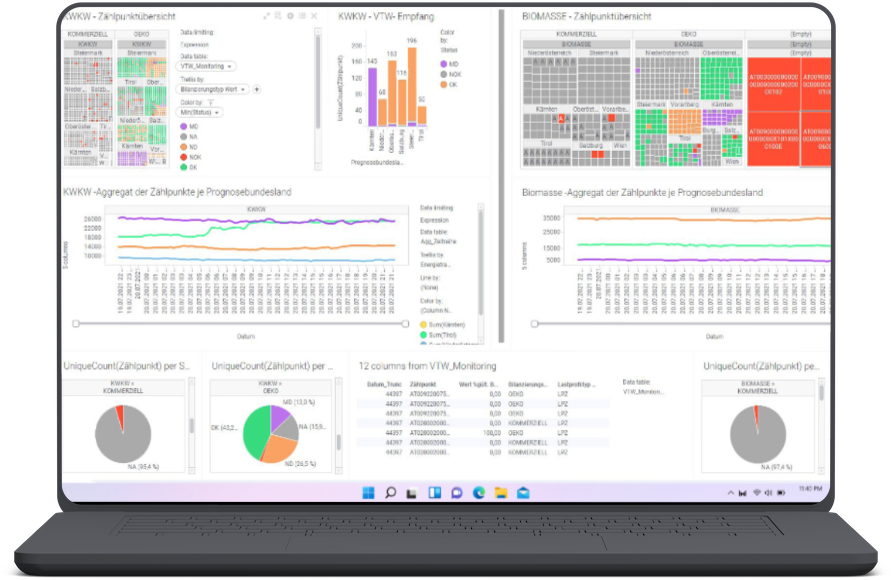
Combine and visualise more data Combine even more data to generate valuable insights: Files, relational and NoSQL databases, OLAP, Hadoop, web services, cloud apps. With Spotfire Data Streams, you can easily connect streaming data such as IoT, social media and messaging information with static data to perform real-time contextual analytics.
Analyses just the way you like them With the multimodal interface, you can individually determine how you want to interact with the data. Whether through natural language search, AI-driven recommendations, or direct editing - you choose the UI method that suits you best.
Instant insights using AI A scalable and robust AI engine identifies relationships in the data and instantly generates recommendations for visualizations to enable lightning-fast insights. Discover trends, outliers and patterns in the data without having to know its structure.
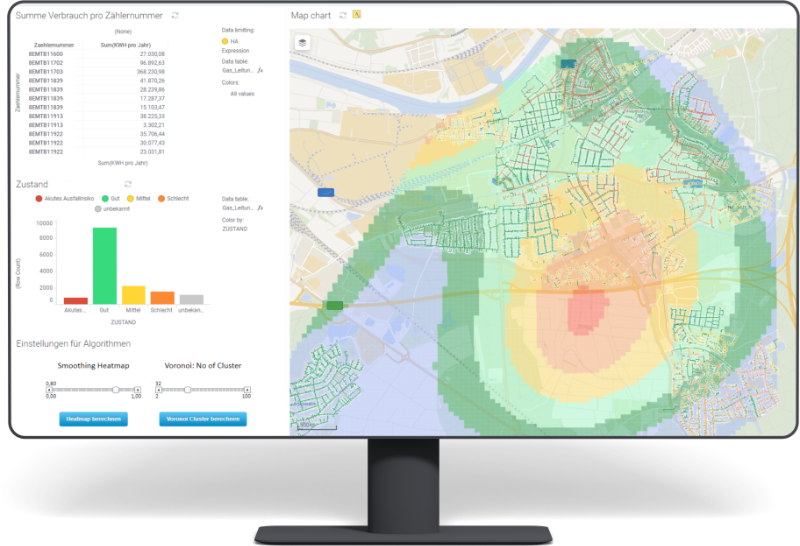
Solve complex problems You don’t have to be an expert to use advanced analytics. GeoAnalytics uses machine learning and statistical methods via an embedded R engine and TIBCO Statistica™. Use real-time data and extend BI to larger parts of your business.
Create process-specific applications Use out-of-the-box functionality and rich APIs to deliver guided process-specific apps that drive different actions across multiple systems. Connect to proprietary data, custom visualisations and calculations, and statistical methods to build apps that support all business processes.
// Interested?
Contact us!
Do you have questions about Spotfire and StatSoft’s services, would you like to purchase a license or request a project? Our project managers and Spotfire experts are ready to help you. Please contact us.