Background and Challenges
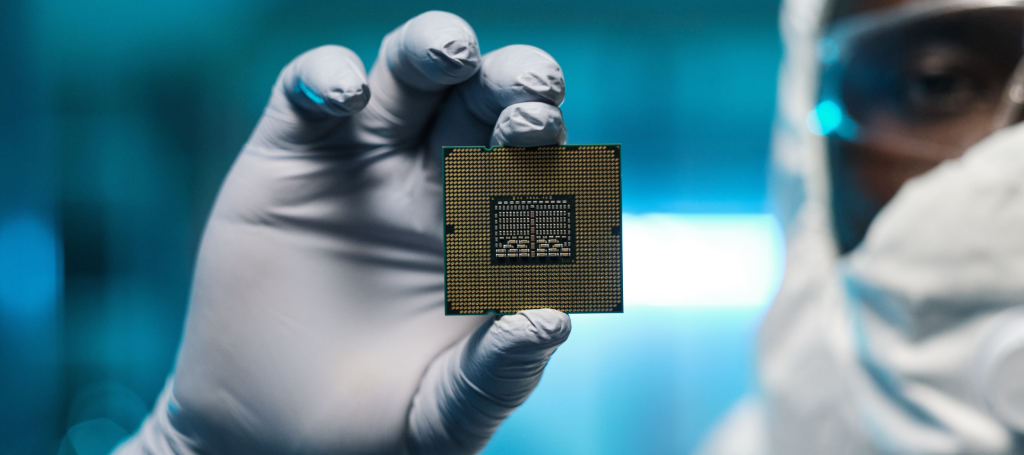
Semiconductors are essential components for a variety of products, including computers, smartphones, consumer electronics, automotive electronics, and medical devices. The reliability and performance of these products depend greatly on the quality of the semiconductors used. Therefore, it is essential for companies to implement strict quality controls to ensure that their products meet high standards.
By systematically monitoring and controlling the production process and product quality, companies can identify potential issues early on and take appropriate measures to improve the product outcome. This leads to a reduction in defects, scrap costs, and recalls, thereby enhancing both financial profitability and customer confidence.
Another important aspect of quality monitoring is compliance with industry-specific standards and regulations. The semiconductor industry is subject to stringent quality standards, such as ISO 9001 certification. Compliance with these standards is crucial to ensure that products meet customer requirements and regulatory obligations. Seamless and effective quality monitoring enables companies to ensure compliance with these standards and minimize potential risks.

Software-based Quality Monitoring
Many companies with the aforementioned requirements employ data visualization solutions, such as Spotfire, for this monitoring. TIBCO Spotfire is one of the most powerful data visualization and analytics platforms that assist companies in capturing, analyzing, and visualizing data from various sources.
The Spotfire software enables the integration and analysis of large volumes of data from various sources, including production data, test data, sensor information, and supplier data. By consolidating this data, companies can identify trends, patterns, and deviations that may indicate potential quality issues. With the integrated visualization capabilities, this data can be transformed into meaningful graphs and dashboards, allowing users to intuitively understand the data and make informed decisions.
Similarly essential for quality monitoring are advanced analytical features, such as statistical analysis, data clustering, and predictive models. These features help identify patterns and correlations in the data that may indicate potential quality issues. By detecting deviations early on, proactive measures can be taken to improve product quality and avoid potential quality problems.
The aforementioned quality standards and requirements are not limited to the semiconductor industry but apply equally to almost all manufacturing companies.
Would you like to learn more about the use of Spotfire for quality monitoring?


